- Published on
Data for the Pankow City Library
Data of the Pankow City Library with Clickhouse & Metabase inspired by the Open Data Information Center.
ODIS does amazing work and I suggest you checkout their work if you haven't already. One of their dashboards that I've approached this time is about the borrowings for the Pankow city library for the year 2022. I didn't know that city library data was so diverse so I decided to visualise it on Metabase.. The Original one is built on Grafana and doesn't support filtering of the data.
Being able to splice and dice the data not only gives some interesting insights but also makes interacting with the it a lot more fun. The library lends not just books but CDs, DVDs, Software, eReaders etc.
Technologies used
- Clickhouse as a database(No particular reason, I just love it).
- Metabase, I host my own instance at Modi's Cafe.
Steps
- Download the dataset
- Check and make changes if necessary
- Create table and insert data in Clickhouse
- Visualize on Metabase.
How does it look?

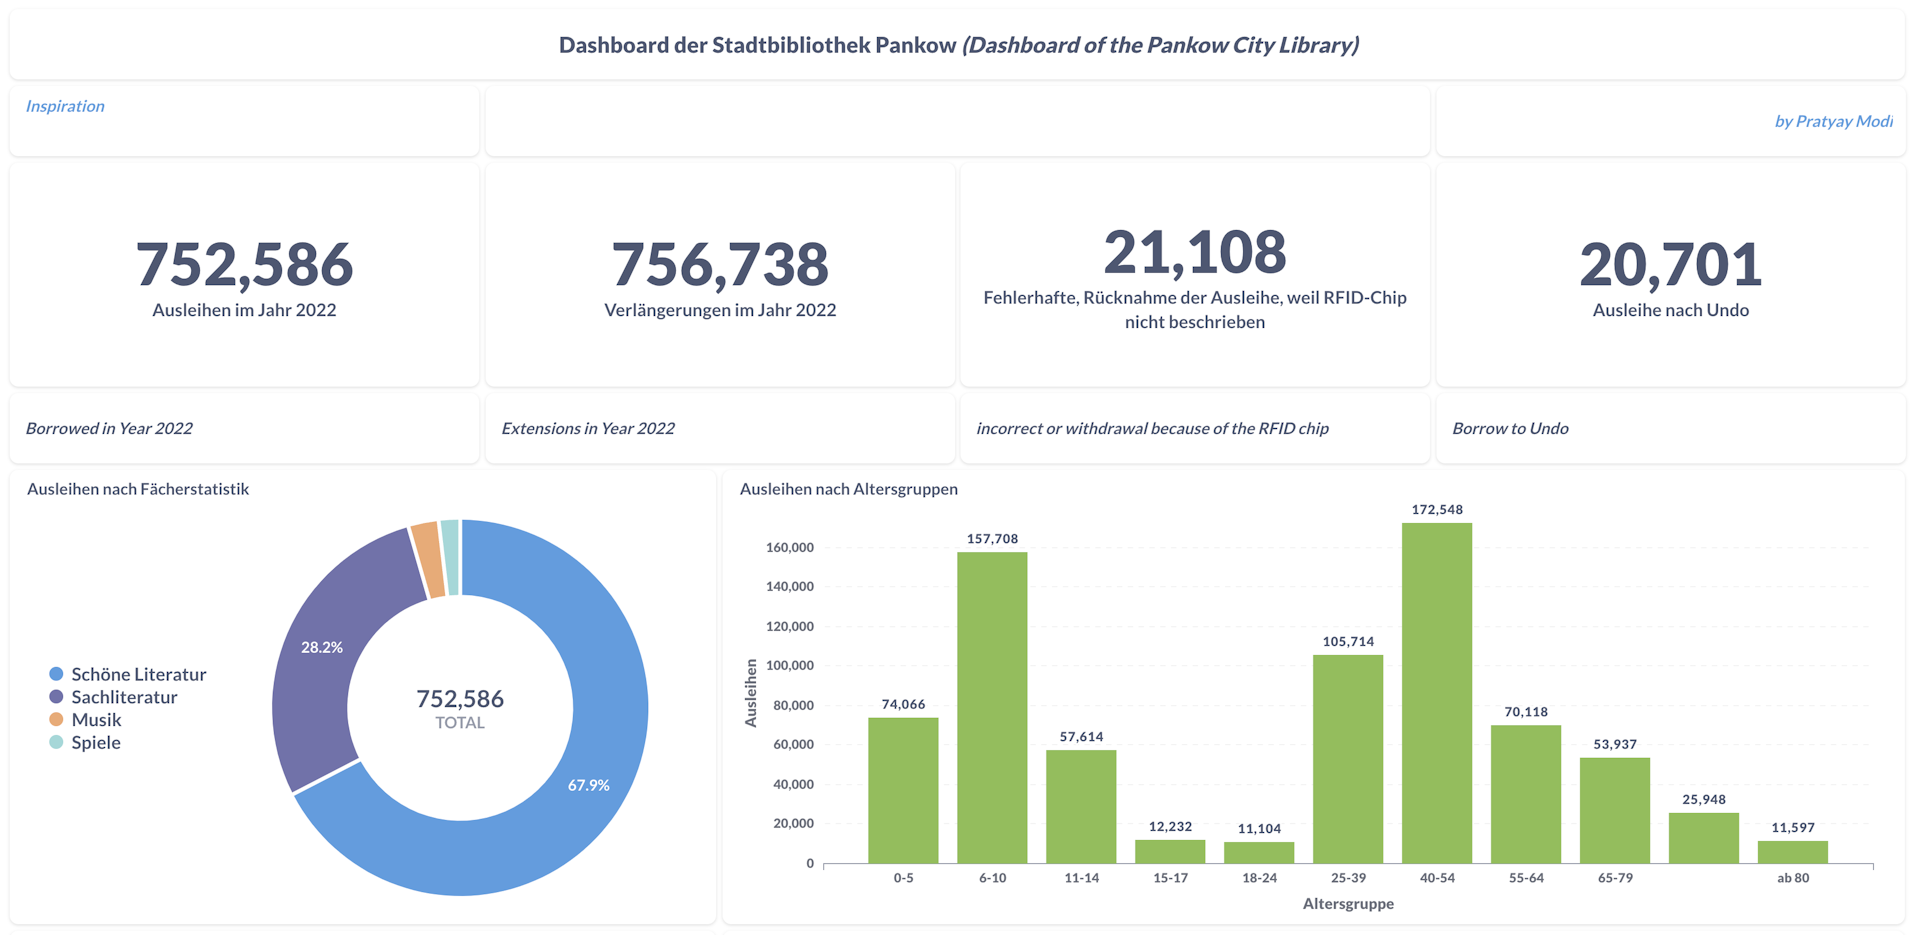
Diving into the data.
Which users borrow music the most?
- Turns out users in the age groups 40-54 and 55-64
- More CDs are borrowed than DVDs

Top 500 borrowings by Refugees
People coming to Germany are most interested in learning the language and they tend to borrow books and media related to that.

Search for borrowings with Harry potter in the Title

Interest in Authors? (Slyvia Plath)
Check the age groups, genders of users who borrowed material authored by Sylvia Plath

Play around with it on your own and have fun. For questions, comments please reach out to me directly.